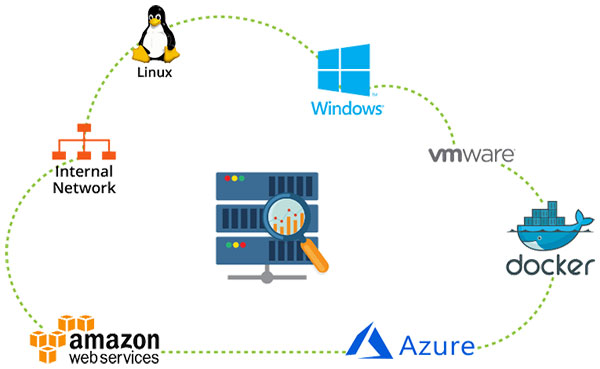
Perspective

Software Outsourcing Codea operates at the intersection of energy, excellence, and invention.

Read more

CSR Initiatives

We set ambitious goals and make strategic investments to drive improvements...

Read more

Diversity

Codea is committed to creating a diverse and inclusive workforce. There´s growing...

Read more

Innovation

The Spark Innovation Ecosystem ‘Applies Next´ beyond what is developed in house...

Read more

Cloud Consulting

We impeccably manage your cloud enablement from choosing relevant cloud services to the successful execution of cloud transformation.

Read more
DevOps

DevOps, Microservices & Serverless

Artificial Intelligence

Our AI services & solutions help gain high-quality and high-accuracy AI capabilities.

Read more
Data Science Consulting Service

Data Science Consulting

Robotic Process Automation

Robotic Process Automation

Staff Augmentation

Codea has already helped 200+ clients augment their teams via hiring dedicated developers. Keep reading to find out what staff augmentation means, what are its benefits, and how to get the most out of augmenting your team with software developers.

Learn More  

Our Industries

Discover how Codea´s breakthrough technologies are transforming industries with smarter ways to do business, new growth opportunities and strategies to compete and win.

Freight & Logistics

ERP For Container Freight Stations
Codea FR8 offers an accurate freight and warehouse management system with built-in redundancies.

Read more

Codea PMIS

Port Management information system
Ports across the globe that have manual and outdated systems and slow paper-based processes are at clear disadvantage in the modern, knowledge-driven world.

Read more
CODEA QUARTO

A complete ERP solution for Manufacturing, Distributing and Service companies.

Read more
CODEA TREAT

An integrated cloud based plug and play to reduce the manual work in an OPD of hospitals/clinics.

Read more
COFIS

A Codea fintech software suite with Core Banking, Insurance, eWallet solutions and Audit management system.

Read more

A FEW CLIENTS WE HAVE HAD THE PRIVILEGE OF WORKING WITH

Accelerate business outcomes with

agile Infrastructure Services

Managed IT As A Service – Its Your Call

Businesses of all size require technology to operate efficiently and effectively. When it comes to small and medium business, IT resources are limited for most business houses and can be quickly overloaded. In cases where you fall behind in keeping up with tasks such as backups, patches, security, etc., Chances of risks increase that you are likely to face an IT outage or allied technology problems in near future which will harm your business.

With Managed Services, you can not only overcome these challenges but also enable you to open exciting new capabilities to choose a suite of offerings that makes it easy for you to select the best of emerging technologies which will help your business become smarter and drive results.

IT infrastructure Managed San diego, Phoenix

The Value Our Managed IT Services Brings To You

Unexpected expenses will affect your budgeted expenses when you are forced to implement unexpected technology upgrades. Our plans can help you to achieve these immediate operational efficiencies within your budget.

IT infrastructure Managed Services Company San diego, Phoenix

Predictable, Fixed Monthly Fee

IT Support  Services Company Phoenix

Peace of mind with 24/7/365 monitoring

Cost-effective access to enterprise-level support

IT Support  Services Company San diego

Minimized downtime

Allows you to focus on running the business, not technology

Increased operational efficiency: no more break-fix as service

Codea offers Managed IT services that are designed to enhance and strengthen your technology strategy and extend your team’s capabilities. We will design an optimized managed services strategy for your company and our support team is all set to complement your in house IT team by providing you with access to domain experts and highly specialized monitoring, automation, reporting and IT management platforms.

24X7 SERVICE MONITORING, BILLING & TECHNICAL SUPPORT

24X7 SUPPORT FOR YOUR BILLING, TECHNICAL & SALES DEPARTMENT

IT infrastructure

Server Monitoring

VMware Monitoring

IT Support  Services

Windows Monitoring

Linux Monitoring

Codea Plugins

IIS Monitoring

File / Directory Monitoring

Docker Monitoring

Cron MonitoringIT Automation

SharePoint Server SQL Monitoring

MS Exchange Server Linux Syslog Monitoring

server maintenance support

Stay on top of outages and pinpoint server issues with root cause analysis capabilities. Create custom plugins and monitor critical attributes. Monitor Windows, Linux, FreeBSD, VMware and Docker.

Gain intuitive insights on the performance of your Windows servers and failover clusters. The monitoring tool provides instant alerts, AI-powered data, and detailed reports to help pinpoint and resolve server outages.

View details on key performance indicators.

Get critical input on your server performance, with more than 40 performance metrics including:

  • CPU, memory, and disk utilization
  • Heat map analysis along with a quick summary of the status and performance of your server
  • Network statistics such as bandwidth utilization
  • Status, thread, and handle count of your services and processes
  • Processor queue length and server uptime

In addition to monitoring more than 40 performance metrics, you can automate incident remediation with Automation tools from Codea.

Monitor all your Microsoft applications in one go.

Start monitoring Microsoft integrations from a single console and take advantage of our growing list of Microsoft Technologies.

  • SQL
  • IIS
  • Exchange
  • Active Directory
  • Failover Cluster
  • SharePoint
  • BizTalk
  • Hyper-V
  • Windows Server Backups
  • Office 365
windows monitoring support

Monitor critical performance metrics of your Linux operating systems and distributions which includes Ubuntu, Debian, CentOS, Red Hat, Fedora, SUSE, Raspberry Pi, CoreOS, and Arch Linux ARM.

50+ performance metrics in a single dashboard.

Designed to provide you in-depth visibility on critical metrics which will ensure that your Linux server is up and running at peak performance, including:

  • A quick summary of the status and performance of your server
  • Load average
  • CPU, memory, and disk utilization
  • Heat map analysis
  • Network statistics such as bandwidth utilization
  • Status, thread, and handle count of your services and processes

In addition to monitoring more than 50 performance metrics, you can automate incident remediation with Codea Performance tools.

50 + plugin integrations to monitor your entire app stack

More than 50 plugins which are ready to install will help you keep tabs on your hosts, devices, services, protocols, applications, and databases. This includes Redis, MySQL, Hadoop, NGINX, Tomcat, Apache, and GlassFish. Execute all your existing Nagios plugins by integrating with Codea and harness the power of the open-source community.

And in case you don´t find the plugin you are looking for we are here to write custom code using a shell script or Python.

Track changes to files, directories, and Syslog.

A minor change that occurs in your Linux server´s files, directories, and logs may be critical for you and that´s the reason its important you receive notifications for even those minor changes. We set thresholds by specifying keywords, facility levels and severities levels and trigger instant notifications whenever these thresholds are breached.

some of the resources that we monitor are given below:

  • URLs and ports
  • Log files
  • Files and directories
  • Linux Syslog

View intuitive reports in easily customizable dashboards.

We compare monitoring metrics and analyze trends using reports in easy to understand formats and dashboards.

Few of the performance reports we offer are given below:

  • Availability Summary Report
  • Health Trend Report
  • Busy Hours Report
  • Performance Report

How it works

The process starts with the installation of the Linux agent by the root user or no root user.

This could be done either through a one-step process or by bulk install the agent onto multiple machines using Chef, Puppet, SaltStack, or Ansible.

Once the installation is successful, performance metrics including CPU, memory, and disk usage will be collected and sent to the Codea data centre. You can view these metrics in the Codea web client. Next step is to set thresholds and become instantly notified of any breach through SMS, email or any of our third-party integrations like Slack, PagerDuty etc.

Monitor VMware
infrastructure.

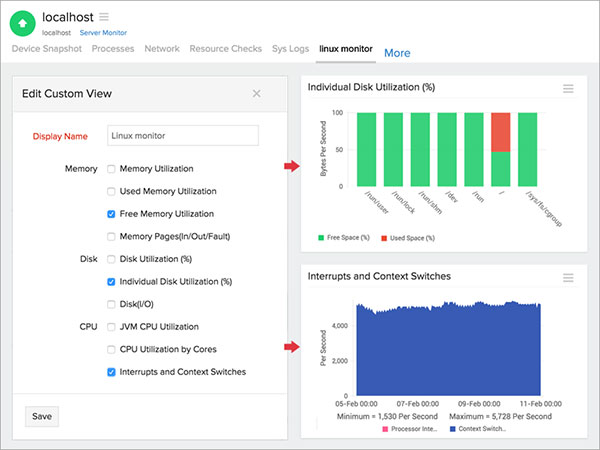
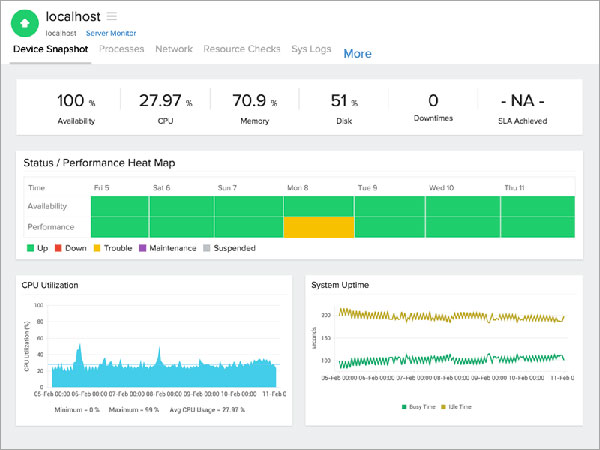
Monitor resource utilization across datacenter, resource pools ,clusters, ESX/ESXi hosts and virtual machines.

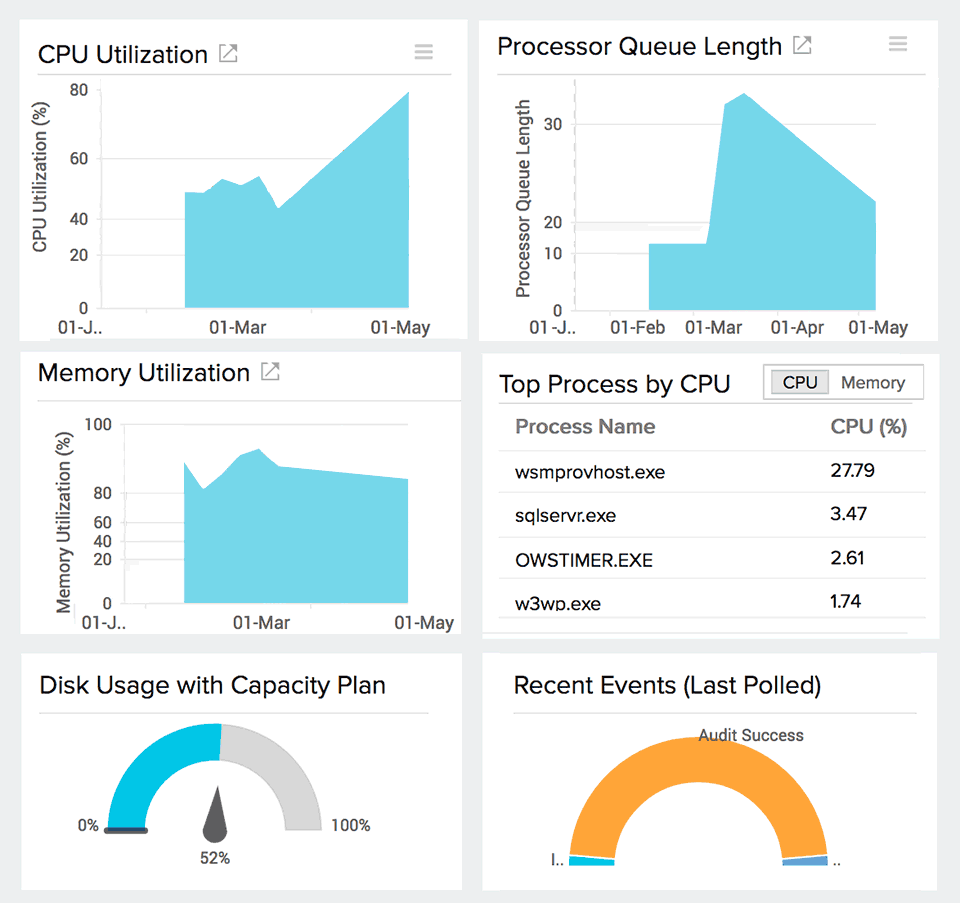
VMware performance counters Tracking.

Gather metrics on compute memory, datastore, disk and network resources for both your virtual hosts and VMs.
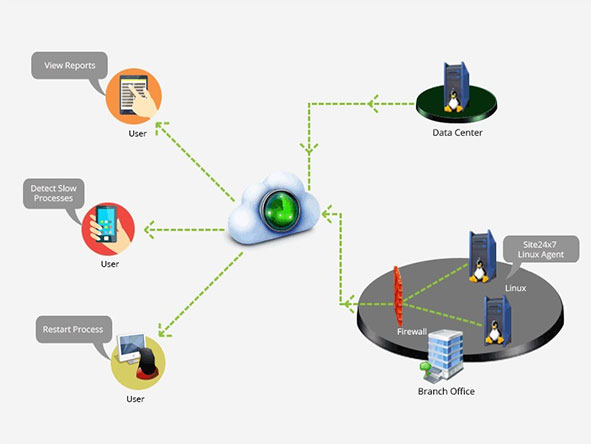
Get alerted for
a host of metrics.

Get Alerts instantly for metric-level changes and threshold breaches through different modes, along with incident details.

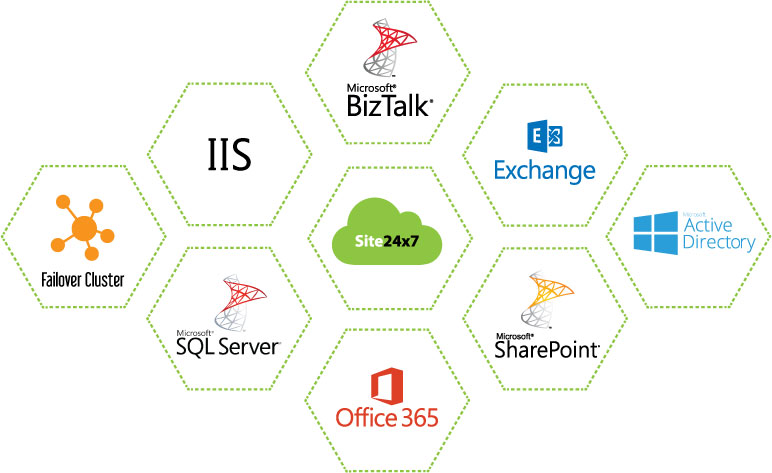
Monitor over 40 + applications with different Plugins.

Monitor Apache Tomcat, MySQL and more than other applications running on your VMs, with selected plugins support.

Application Performance Monitoring

Identify application servers and app components that are generating errors. Monitor for Java, .NET, Ruby, Node.js, PHP, AWS, Azure and mobile platforms.

Synthetic Web Transaction Monitoring

Record and simulate multi-step user interactions in a real browser and optimize login forms, shopping carts and other applications.

Real User
Monitoring | RUM

Gauge the application experience of real users. Analyze and segment performance by browser, platform, geography, ISP and more.

RMM for
MSPs and CSPs

Manage your customers' IT infrastructure efficiently with our secure, scalable, and affordable monitoring suite for Managed Service Provider and Cloud Service Provider.

Log Management
from the Cloud

Collect, consolidate, index, search, and troubleshoot issues using your application logs across servers and datacenter sites. With support for common applications and log frameworks getting started is very easy.